
The Business Intelligence existed before people started talking about Big Data and Data Analytics: it was – the process that collects business data and processes them returning them legibly (diagrams, filterable tables, charts, histograms, and so on and more meta) but above all useful for business analysis.
What is Business Intelligence (BI)?
Business Intelligence (BI) is a technology-driven process for analyzing data and presenting information that can be used to help executives, managers, and other business users make business decisions.

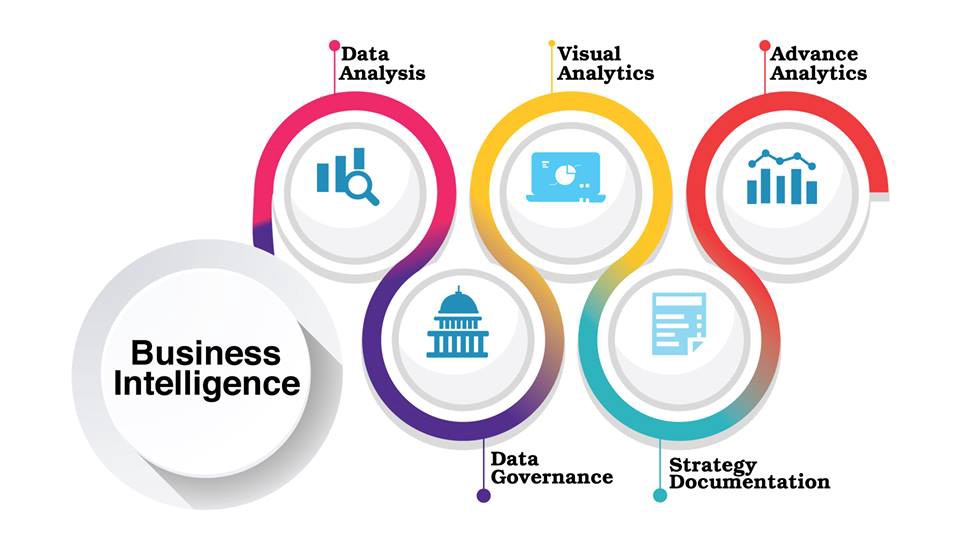
Business Intelligence Solution includes a wide variety of tools, applications, and methodologies that allow organizations to collect data from internal systems and external sources; prepare it for analysis; develop and query these data; and create reports, dashboards and data visualizations to make analytical results available to business decision-makers and operational workers.
Data, Information and Decision-making Power
The data itself is nothing: a sequence of digits. It acquires meaning when associated with an identity, it becomes a value: even more, a value not extrapolated from the context, but as part of an ecosystem of data that make up the framework of the company, its assets, liabilities, and its potentials. That is, data becomes information: a resource, a raw potential to give voice to. Information generates knowledge and knowledge makes choices possible.
Why is business intelligence important?
Business intelligence app include accelerating and improving decision making, optimizing internal business processes, increasing operational efficiency, increasing revenue, and gaining a competitive advantage.
BI data can include historical information stored in a data center, as well as new data collected by the source systems as it is generated, allowing BI tools to support both strategic and tactical decision-making processes.

Data visualization tools have become the standard of modern BI in recent years. Some leading vendors have defined the technology in advance, but more traditional vendors have followed their path. Now, practically all major BI tools incorporate visual data detection capabilities.
Analyzing Data: What Business Intelligence does
Analyzing data is a long process of precision, continuous control, and verification: analyzing means processing data, synthesizing, and aggregating them. Processing them, on the other hand, means taking the collected data and presenting it so that the same data becomes information and effectively helps in guiding and supporting business choices.
The Business Intelligence app solution, therefore, includes the entire set of methodologies, processes, architectures, and technologies capable of transforming a datum to its “raw” datum into useful information to trigger strategic choices for the corporate business.
Ultimately, BI analyzes to understand the phenomena behind the data flows, brings out causes and consequences, and is thus capable of generating estimates and simulating likely case studies.
Not just big names: Business Intelligence Applications for SMEs
What happens when companies meet BI? And what do they expect to get out of it? Since Business Intelligence puts company data at the center, it is of the utmost interest for the company itself, but in order to get the most out of it, it must be able to interact constantly with that data, to be able to internalize and distribute it to internal departments: because if BI was once the prerogative of only the management team, today the information it displays is also made available to the operating departments, from marketing and sales to administrative ones.

Not only that: until a few years ago, BI itself was a tool available only to big brands, while today new technologies make it accessible also to small and medium-sized enterprises that can draw on it as a new source of analysis and prediction company.
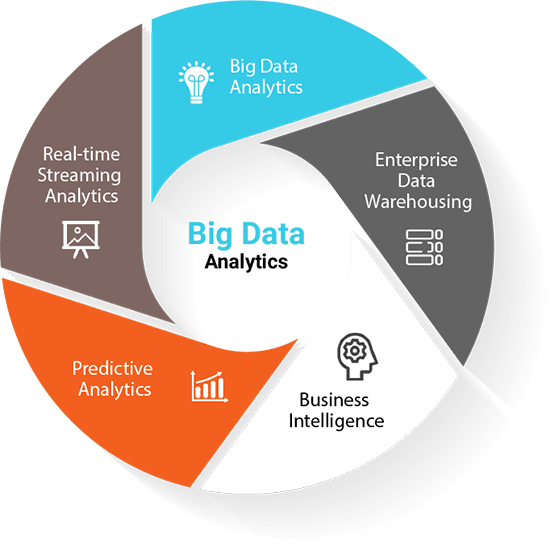
Big Data and Analytics
Where and how do the aforementioned “Big Data Solution” fit into this picture? First of all: what are Big Data? Let’s talk about Big Data in reference to that phenomenon – typical of the last decade – which leads to having every day and in exuberant quantities an incredible amount of data that requires new paradigms, tools, and methodologies to be processed.
Stop for a moment and just imagine the volume, variety, and speed of information that transits every day from devices all over the world (corporate data, data from social channels, emails, production machinery, software, and connections, etc.), billions of sources that incessantly produce data without stopping. Now let’s focus on what is the typical company reality: what data does it collect and from what sources?
A typical SME collects a large amount of “Big Data” every day: from its customers, from its management, from the commercial department, from corporate social networks, from LinkedIn, from the employees themselves.
This is all information with high strategic potential, thanks to which it is possible to plan decisions and business plans starting – precisely – not from subjective impressions, but from the company’s concrete data: you only need to find ways to organize them, make them readable and interpretable, allow filtered or transverse readings. So what do you need? Business Intelligence, exactly.
Design Business Intelligence Applications for SMEs
It is important to understand that when we go to develop a Business Intelligence application for a company we are not doing a simple report (e.g. half-yearly sales report), an operation that could trivially be performed from a simple spreadsheet to the most sophisticated sales management software. To give a concrete example while remaining in the sales analysis area, what a BI application typically does is give a picture of:
- The “what” happened (sales figure).
- The “why” happened: data usually provided by the customer (spontaneous request? Evolutionary need? Adjustment of the law?)
- The projection of one or more future scenarios based on multiple objective data: e.g. possible sales scenario/investment choice, probable need to reinforce labor, etc.
It is therefore not a matter of having a simple multidimensional reporting, but of exploiting through a dedicated application in which it is possible not only to trace the history of sales, for example but also to cross it with commercial initiatives or with the potential to supply raw materials and down more and more widely by aggregating multiple data from absolutely independent sources to delineate the decision-making framework for the following quarter.
A decidedly different tool and a thousand times more powerful, don’t you think?